When you look at all of the metrics multichannel companies can use to measure customer service, Initial Order Fill Rate, or the percentage of orders that shipped complete, is the one that we think is best. But it’s also not often used.
Many consider IOFR to be just an inventory measure. But, its usefulness goes far beyond that. Here are four fill rate metrics and their formulae that companies use:
Backorder rate
Backorder rate is the percentage of order lines that cannot be shipped out because of stock outs compared to the total items ordered for the day. Generally, this is run at end of day and there is no archived back history by day or cumulative history. As a result, there is no view of backorder data by day or by vendor and their products or categories.
Backorder rate % = total order lines not shipped today because of out of stock divided by total order lines for the day multiplied by 100

Line item fill rate
Line item fill rate is generally calculated the opposite of the backorder rate, above, and compares the percentage of order lines shipped today to the total items ordered for the day. Generally, this is run at end of day and there is no archived line item fill rate history by day or cumulative history.
Line item fill rate % = total order lines shipped today divided by total all lines ordered today multiplied by 100
Initial order fill rate
Initial order fill rate is the percentage of orders that are shipped complete – including all of the items on the customer's order — within your company’s shipping standard, the date the customer requested, or the promised date.
For in-stock product, the shipping standard of most well-run operations is 24 hours from receipt of an order. To compete with Amazon, many companies are shipping all orders same day.
Initial order fill rate % = Number of orders shipped complete (all line items) divided by total orders taken today multiplied by 100
Final order fill rate
Final order fill rate is the number of customer orders which are ultimately filled complete – with all line items ordered - viewed over a longer period of time, such as a promotion, end of catalog, or season.
Final order fill rate = total orders shipped complete (all items) divided by total orders received over timeframe multiplied by 100
Four Initial Order Fill Rates Case Studies
To understand IOFR’s value better, let’s look at some results from four clients that had not previously measured IOFR:
EXAMPLE 1: A $90 million apparel business with catalog and ecommerce channels. Fifty percent of the styles are reorderable. The graph below shows the pattern for Initial Order Fill Rates when charted weekly for 52 weeks. The numbers are highly variable, with the Initial Order Fill Rates as low as 52% one week and up to 80% another week. It varies also depending on when item receipts are initially received just before season starts. 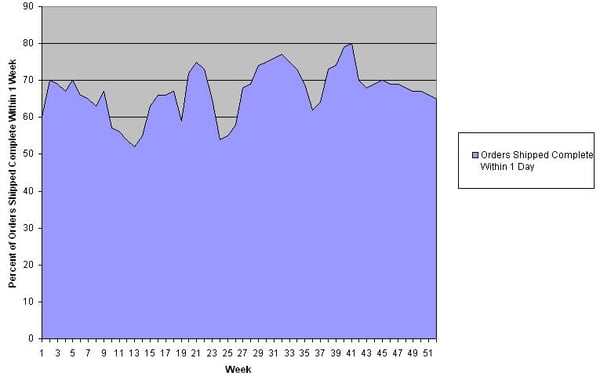
EXAMPLE 2: A $25 million apparel ecommerce company with 3.0 lines per order. Seventy-five percent of the products are reorderable by purchasing. This company always used the backorder rate to gauge its in-stock position and customer service. The backorder rate is about 10%, day in and day out, so the client inferred a 90% service rate.
The company’s first Initial Order Fill Rate report showed a rate of 76.5% for an entire season. In our experience, the Initial Order Fill Rates is generally 10-15 full percentage points below the item fill rate or the backorder rate.
EXAMPLE 3: A $30 million food business that averages 2.25 lines per order. Before developing the Initial Order Fill Rates report, management characterized their “backorder rate as low.” Their first week’s Initial Order Fill Rates report showed an 88.5% initial customer order fill rate - not shipping 11.5% of the customers when they got the order.
EXAMPLE 4: A $50 million wholesale and ecommerce multichannel company to retail accounts, Amazon, and eBay. When we did the assessment, we found that the wholesale accounts’ vendor compliance policies were so stringent that much of the inventory first went to filling their orders. The company’s own customers suffered with much lower Initial Order Fill rates.

More Initial Order Fill Rate details
Here are seven details to consider about fill rates:
- Inventory availability: When the customer order is shipped from the fulfillment center, to a large degree, is governed by in stock rates. Yes, fulfillment centers can and do mess up. However, whether the customer gets the order in a timely fashion starts with being in stock a high percent of the time.
- Customer service indicator: IOFR reflects immediate ship or meeting the customer’s expected delivery date. No customer gives you a 3-line order and feels good about getting 2. It’s surprising how many times we hear how penalizing this calculation is – “we shipped 2 out 3 but got no credit.” That kind of rationale leads back to using line item or backorder fill rates as the metric.
- No history, difficulty planning: New products and proprietary product often sell well, but have no sales history to use in purchase planning. A popular product often strips the inventory and creates a low initial order fill rate.
- Optimizing inventory levels: We all know that there is a balance point between Initial Order Fill Rates and inventory turnover ratio. No business can service 100% of all orders daily and have an acceptable inventory turnover ratio without running the risk of overstocks. The challenge is to find the optimal inventory point and determine how much risk you want to take.
- Backorder costs: The merchant also needs to take into account the cost of backordered merchandise. Studies show it costs $15 to $20 for each backordered unit of merchandise.
- Tailor calculations to your operation: Many fulfillment centers only ship 5 days per week. However, orders may can come via the internet 7 days per week. If you use a 7-day weekly calendar, you’ll have 2 days with zero Initial Order Fill Rates. In other words, a weekly graph would have two days of zero and drag down the weekly graphical depiction and calculation.
- Delve into merchandise departments and categories: To apply Initial Order Fill Rate further, report it by merchandise category, department, and classification, as well as the total business’ weekly rate and annual graph by week. Add it to your key performance indicator (KPI) dashboards. You will gain a new perspective on how well you’re serving your customer.


SHARE